


Story points, explained for the founder paying the bill
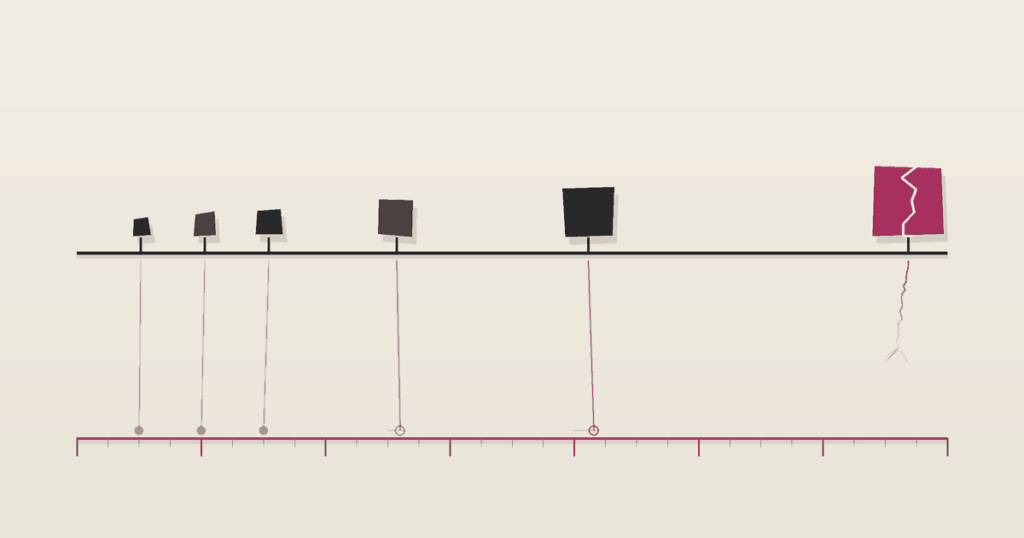
Your team says the payments rebuild is 13 points. You’re trying to work out whether that’s worth what you’re spending this month. Here’s what story points actually measure, why nobody will convert them into hours for you, and what to watch instead.
Three sprints into a build, a founder we work with stopped the review and asked the question the whole room had been dancing around. “The team says the payments rebuild is 13 points. I’m paying real money every month for this. What am I actually buying?”
Nobody gave him a clean answer. That’s normal. It’s also a failure.
So, cleanly: a story point is a unit of relative size, not time. It bundles three things into one number: how complex the work is, how uncertain it is, and how much of it there is. Its only job is to compare one piece of work against another piece of work on the same team. A 5-point story is expected to be roughly five times the lift of a 1-point story, for that team, this quarter. By design, it says nothing about hours.
Which is a problem, because hours are what you’re buying.
That tension is the whole subject of this article. The agile canon says never convert story points to time. The canon is right, and it is also quietly unhelpful to the one person in the room who has to sign the invoice. Both things are true, and you can hold both if you understand what the instrument was built to do.
What a story point actually measures
Story points came out of Extreme Programming in the late 1990s, and they were a fix for a specific failure: developers are famously bad at estimating hours, and they are much less bad at estimating ratios. Ask an engineer “how long will this take?” and you get a number shaped by optimism, by who’s asking, and by what they think you want to hear. Ask them “is this bigger or smaller than the thing we shipped last week?” and you get something closer to the truth.
That’s the entire trick. A point is a comparison, anchored to work the team has already finished.
Three ingredients go into the number:
- Complexity. How many moving parts, how many unknowns in the design, how many places it can go wrong. Integrating a payment provider you’ve never touched is complex even if the code is short.
- Uncertainty. How much of this is discovery? A story that depends on an undocumented third-party API carries risk that a form field does not.
- Volume. The sheer amount of work. Forty near-identical screens can be simple and still large.
An 8-point story is not “a hard 3-pointer.” It’s a story that the team, comparing it against everything they’ve built together, believes is roughly eight times the size of their smallest reference story. If your team can’t point at a past story and say “this is our 1,” their points are decoration.
That’s the first thing worth checking as a buyer. Ask which finished story is their anchor. A team with a real answer is estimating. A team without one is guessing in a costume.
Why story points go 1, 2, 3, 5, 8, 13
Most teams estimate on a modified Fibonacci scale: 1, 2, 3, 5, 8, 13, 21. The gaps get wider as the numbers get bigger, and that’s the point, not an accident of arithmetic.
Precision collapses as size grows. A team can genuinely tell the difference between a 1 and a 2. They cannot tell the difference between a 20 and a 21, and if you give them the option, they will spend forty minutes pretending they can. The widening scale forces the estimate into buckets that are honest about their own error bars.
The scale also functions as an alarm. Once a story lands on 13 or 21, most disciplined teams won’t estimate it at all. They break it down. A 21 is not an estimate, it’s an admission that the work hasn’t been understood yet. If you’re seeing 21s survive into a sprint, that’s a signal worth pulling on, and it usually means the user stories were written too coarsely to be built from.
Jira’s default 1, 3, 5, 8 is the same idea with a smaller vocabulary. Nothing about the tool changes the logic.
How many hours is a story point?
This is the most-searched question about story points and the one every article on the first page of Google refuses to answer. Here is the honest answer, in three parts.
Part one: officially, none. There is no conversion, and Mike Cohn has been saying so for two decades. A point is not an hour, a day, or a half-day. Two teams in the same company can both be running 30 points a sprint and be moving at completely different real-world speeds, because their points are calibrated to different anchors. Points are not portable between teams, and they are not portable between quarters if the team changed.
Part two: your team is already doing the conversion in their heads. Of course they are. Every developer who has ever pointed a story has thought “that’s about a day and a half.” The math exists. It’s just informal, private, and constantly re-tuned.
Part three: you can compute the only conversion that matters, and it’s backward-looking. Take what the team actually costs you in a sprint. Divide it by the points they actually completed in that sprint. That gives you a cost per point for this team, on this build, over this period. If a two-week sprint costs you $20,000 and the team reliably lands 40 points, your effective rate is $500 a point, and that 13-point payments rebuild is a ~$6,500 decision.
That number is useful. It’s the number that lets you decide whether a feature is worth building at all, which is your job, not theirs. It also survives contact with reality, because it’s derived from what happened rather than from what someone hoped would happen.
But it comes with a rule, and the rule is load-bearing.
The moment story points become a price, they stop being an estimate
Do the conversion. Don’t publish it.
The instant a team learns that points are being converted into dollars and read back to them, points stop measuring size and start measuring self-protection. Estimates inflate, quietly and universally. Nobody decides to do this. It just happens, the way water finds a slope.
This is Goodhart’s law, in the sharper phrasing the anthropologist Marilyn Strathern gave it: when a measure becomes a target, it ceases to be a good measure. Story points are unusually fragile in this way because they’re self-reported, unverifiable from the outside, and estimated by the same people whose output they measure. There is no independent audit of whether a story “really was” a 5. Point inflation is undetectable by construction. You will never catch it, because there is nothing to catch it against.
Ron Jeffries, one of the people who put story points into the world, has since spent years arguing they get misused precisely like this. His summary, in Story Points Revisited, is worth the fifteen seconds it takes to read: “I may have invented story points, and if I did, I’m sorry now.”
So hold the cost-per-point privately, use it to make your own build/skip decisions, and never wave it at the team in a sprint review. The founders who get this wrong end up with a team whose velocity chart looks fantastic and whose delivery date keeps moving. They’ve optimized the number and lost the thing the number was for.
What 1, 3, 5, 8 and 13 points look like in a real build
Points aren’t portable, so any table like this is a sketch and not a standard. But founders keep asking for a reference, and refusing to give one is the reason the existing articles on this topic are useless. Here’s a rough shape, calibrated against the kind of work an early-stage product team actually does:
| Points | What it usually looks like | Rough shape of the work |
|---|---|---|
| 1 | Change a label, add a field to an existing form, fix a copy bug | Understood completely, no unknowns, done in a sitting |
| 2 | Add a filter to an existing list view; a small validation rule | Known pattern, small surface |
| 3 | A new simple screen using components that already exist | Familiar work, a few touchpoints |
| 5 | A new CRUD flow with its own permissions and states | Several parts, some design decisions, one or two unknowns |
| 8 | Integrating a third-party service the team has used before | Multiple systems, real edge cases, error handling |
| 13 | Rebuilding payments; a new auth model; anything touching money or identity | High complexity, high risk, should probably be split |
Two things to take from this. First, the jump from 5 to 8 to 13 is where the risk lives, and that’s where you should be spending your attention in sprint planning. Second, if your team’s 13s look like other teams’ 3s, they aren’t overcharging you. They’re calibrated differently, and the only comparison that matters is against their own history.
Velocity is the number to actually watch, and how to read it
Velocity is the total points a team completes in a sprint. Averaged over the last three to five sprints, it’s the closest thing you have to a forecasting instrument: points remaining in the backlog, divided by velocity, gives you sprints remaining.
Read it for stability, not for size. A team running a steady 32, 30, 34, 31 is a team you can plan a fundraise around. A team running 45, 20, 50, 18 is a team whose estimates mean nothing yet, and their average of 33 is a lie told with arithmetic. High variance is the signal. Chase the variance, not the ceiling.
Three things quietly corrupt a velocity chart, and all three are worth asking about:
- Carryover. Points that get counted when a story rolls into the next sprint half-finished. If unfinished work scores, velocity stops meaning “delivered.”
- Re-pointing. A story that was a 5 last sprint and is somehow an 8 this sprint, without the scope changing.
- Comparing across teams. Two squads, two calibrations. Never put them on the same chart.
Four questions to ask in sprint planning when you’re not technical
You don’t need to understand the code to audit the estimate. You need to understand whether the estimate is real. These four questions do that, and none of them requires you to know what a database index is.
- “What’s your reference story for a 1?” If they can’t name a finished piece of work, the scale isn’t anchored and every number downstream of it is invented.
- “What’s the uncertainty in this one, and what would make it bigger?” A good team answers instantly and specifically: “if that API doesn’t support partial refunds, this doubles.” A team that says “it should be fine” hasn’t looked.
- “What did we point this at last time, and what did it actually take?” The only real calibration check. Teams that track it improve. Teams that don’t, drift.
- “What’s the smallest version of this that a customer could use?” Not a points question, but the most valuable question in the room. An 8 often contains a 3 that would have been enough.
When story points are the wrong instrument entirely
Story points assume an ongoing team, a stable backlog, and a working relationship where you’re buying capacity over time. If that’s not your setup, they’re the wrong tool and you should stop asking for them.
If you signed a fixed-scope, fixed-price contract, points are irrelevant to you. You’ve bought an outcome, not a rate, and the vendor’s internal estimation method is their problem. If you’re on time and materials, points are useful but they aren’t the contract, and the difference between those two arrangements matters far more to your budget than any estimate ever will.
And if a vendor is quoting you in story points on a proposal, before any team has built anything together, that number is decoration. There’s no shared history to anchor it to. Points don’t exist until a team has finished work together, and a point from a team you’ve never worked with is a number with no denominator.
FAQ
How many hours are 5 story points?
There’s no official conversion, and any vendor who gives you one without qualification is telling you what you want to hear. Practically: divide what a sprint costs you by the points that sprint delivered, and you’ll get a cost per point for that team. Use it for your own decisions, keep it off the sprint review agenda.
Is 1 story point equal to 1 day?
No, and the teams that let this equivalence take hold usually end up with a scale that’s just “days” wearing a disguise. When that happens you’ve lost the relative comparison that made points useful and kept all the overhead.
Why are story points 1, 3, 5, 8?
Because estimation precision decays as work gets bigger. The widening gaps between numbers stop teams from arguing about differences they can’t actually perceive, and force big, poorly-understood work into a bucket that says “break this down.”
What are 5 story points in Agile?
Roughly five times the size of the team’s smallest reference story, in complexity, uncertainty and volume combined. On most early-stage product teams that shape looks like a self-contained flow with its own states and permissions. On your team, it’s whatever your team’s history says it is.
Can I compare our velocity to another company’s?
No. Points are calibrated per team. A company running 60 points a sprint is not twice as fast as one running 30. It’s a different measuring stick, and the comparison tells you nothing except that someone in the conversation wants to win it.